A recent PR, #24613, added a policy for duplicate PRs. It got me wondering: what actually happens to PRs from people coming to php-src for the first time? How many are accepted, how many rejected, plus quality — how much is genuinely useful work and how much is “AI slop”.
This small study shows the real picture, with numbers based on a dump of the repo’s PRs.
In short. 50% of newcomers’ PRs are accepted, 73% of the completed ones. Rejection is almost never about bad code — it’s that the change isn’t wanted. Acceptance depends heavily on the author: for a typical newcomer (one PR) it’s closer to 27%, but after a first accepted PR the acceptance rate more than doubles, to 66%. More than half of all PRs come from ten active contributors, who also pull the averages up.
What I counted
To identify new participants I pulled all 18,756 PRs over 15 years from the current repository; a new participant is someone who had not opened a PR before the analysed period. That gives 831 PRs from 219 first-time contributors — roughly a quarter of all PRs in the period, from about two thirds of all authors. Over the whole period (24 Oct 2025 – 24 Oct 2026) there were 3,285 PRs from 321 authors.
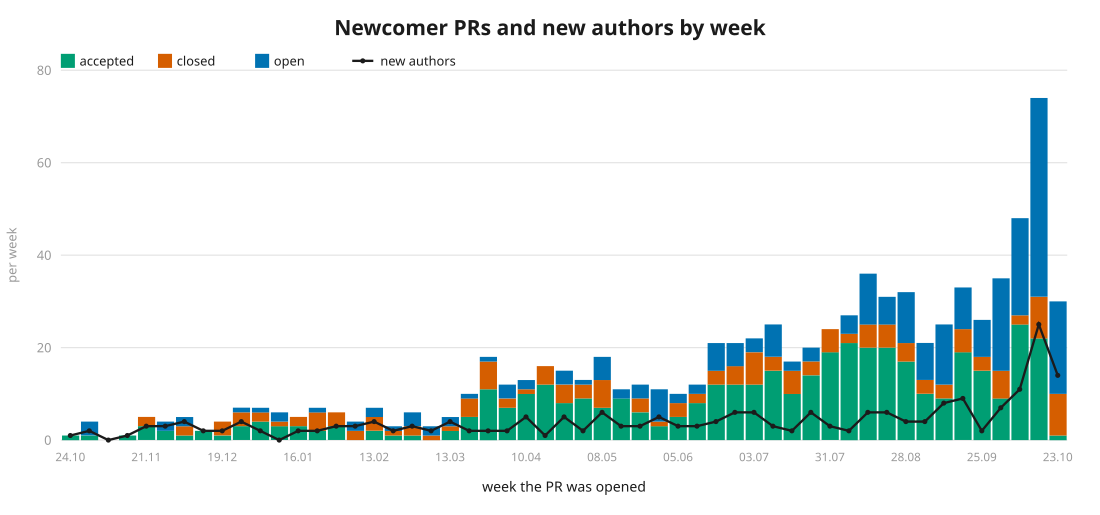
The flow of newcomer PRs grew significantly over the year — from 2–5 a week a year ago to 30–70 now, peaking in the final week. The open ones (blue) pile up toward the end simply because recent PRs haven’t had time to reach an outcome yet — you can’t directly compare acceptance in early and late weeks from this chart.
For each PR I recorded the status, whether tests were present, the affected extension, and signs that the description was AI-generated or contained hallucinations. I checked the outcome and the reason for closing by analysing the discussion with an LLM, not just by the GitHub status — because the GitHub status alone doesn’t always tell you whether a PR was really accepted or rejected.
The funnel
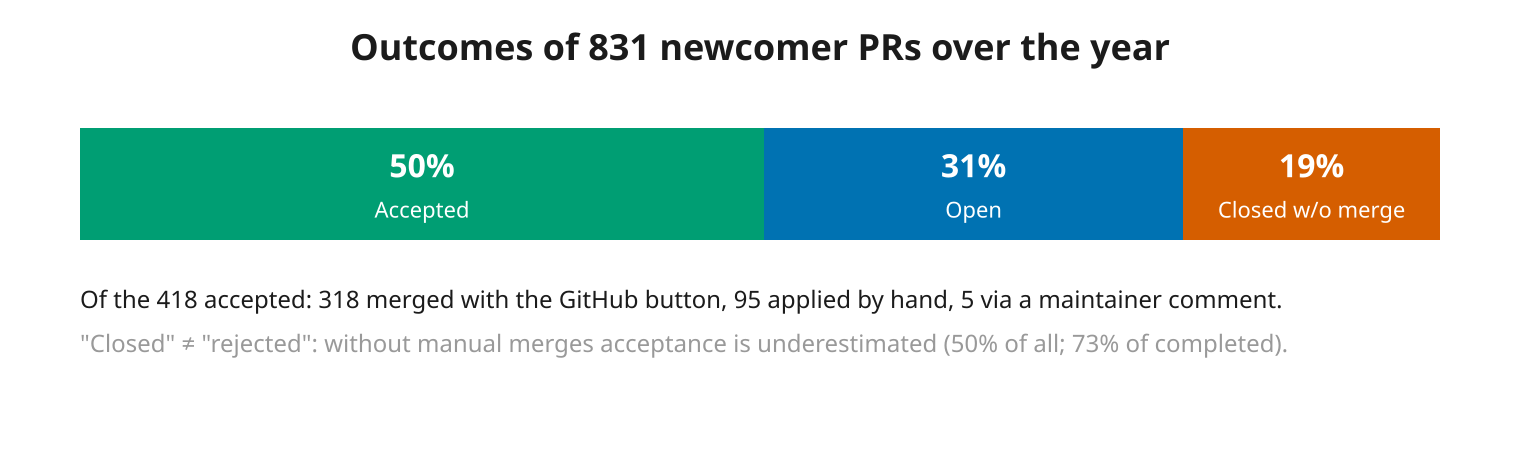
Of 831 PRs:
- 418 accepted (50%). This is not only the Merged status, but also Closed in cases where the change was applied by hand by a maintainer or the commit made it into the main branches one way or another — a common practice in php-src because of how the release branches work.
- 256 still open (31%). No outcome yet.
- 157 closed without a merge (19%).
If you look at acceptance among the completed PRs only, it’s 73%, which isn’t that low. But it’s more important to look into the ones that still have no decision.
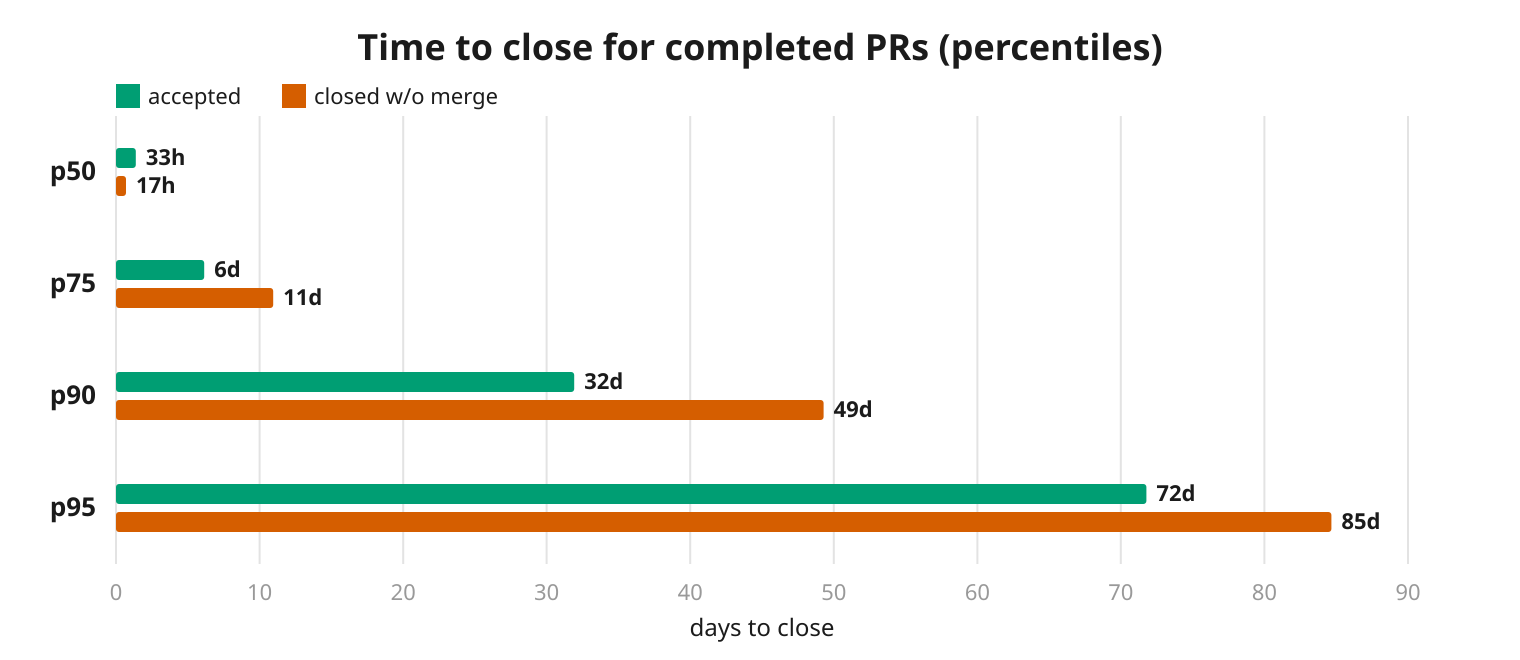
Time to close for completed PRs is heavily skewed: the median is about a day (accepted ~33 h, closed without a merge ~17 h); by p75 it’s already 1–2 weeks, and the tail is long — p90 is 32/49 days, p95 is 72/85. Closed-without-merge PRs are faster at the median (lots of quick triage closes) but drag on longer than accepted ones in the tail.
Why PRs get closed
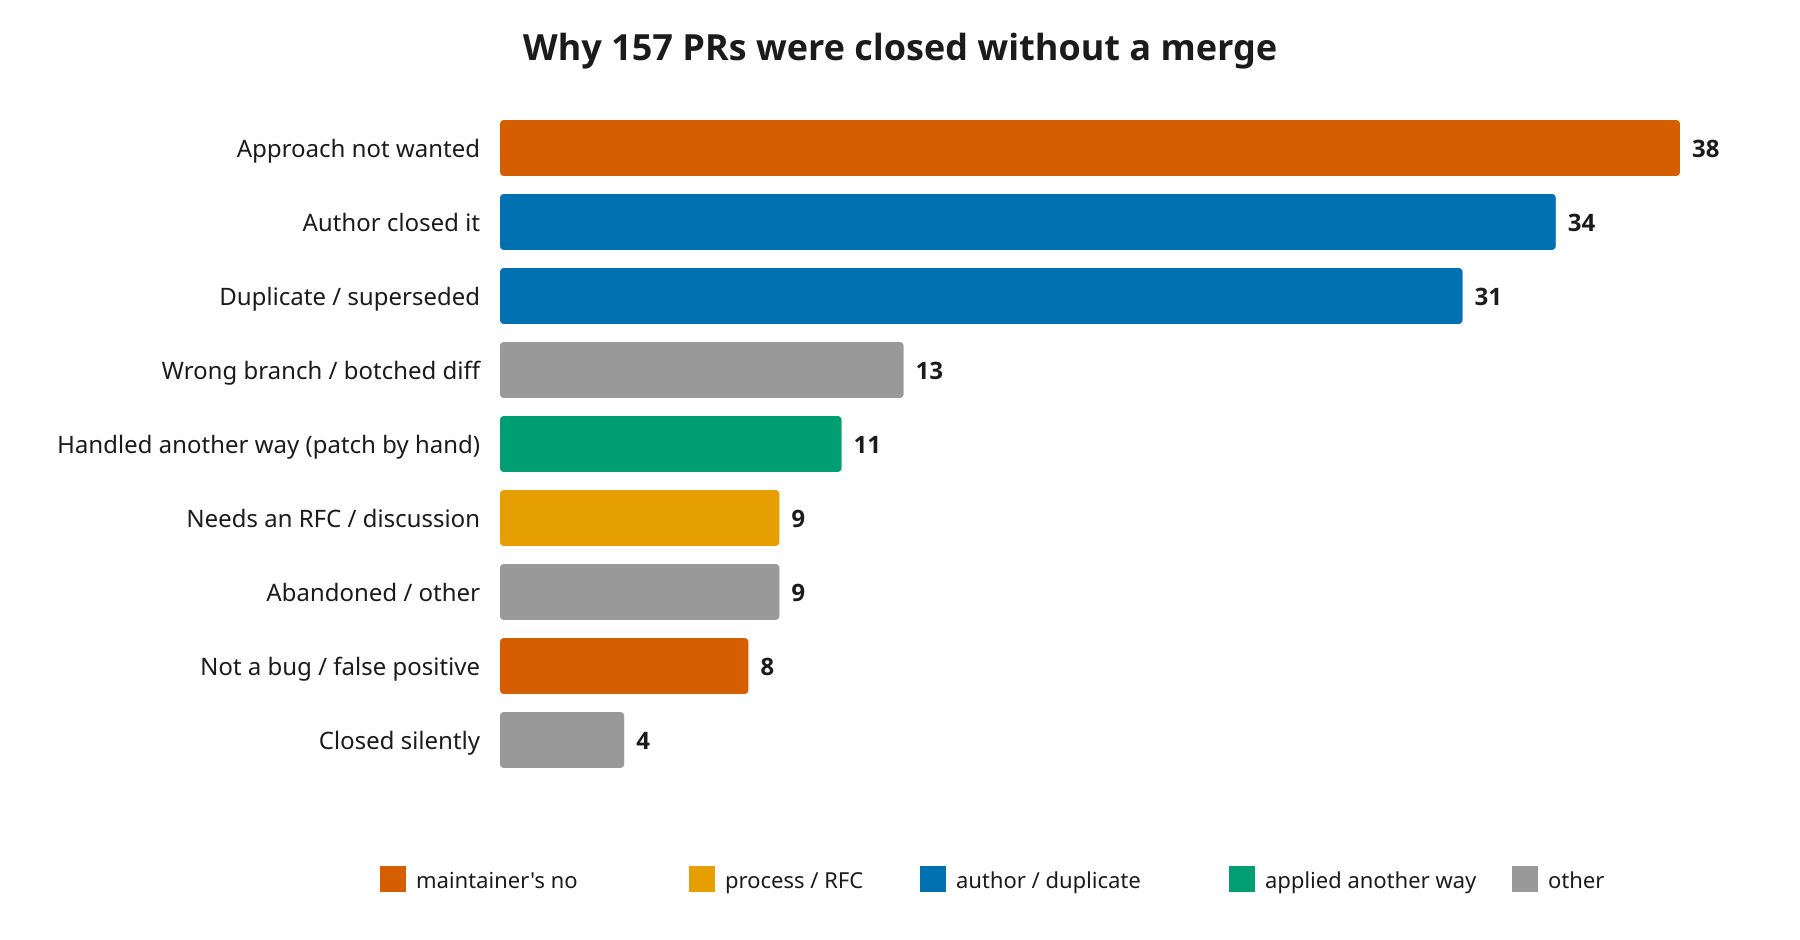
All 157 PRs closed without a merge were processed with an LLM — the closing comment, the reviews and the close event were analysed. The reason was stated explicitly in the discussion for 124 of them; the rest were inferred from metadata.
The one who closed the PR was most often the author — 100 of 157. This doesn’t contradict the chart, where “author closed it” is 34: those 34 are voluntary withdrawals with no other reason, while the rest of the self-closes are spread across other reasons (duplicate, wrong branch, etc.), often right after a maintainer’s comment. The largest reason is that the change isn’t wanted by the project (the problem deliberately won’t be fixed for one reason or another, a BC break, a false-positive from static analysis, cases that can’t actually occur). Cases where the code itself was called wrong are rare. Newcomers’ PRs are mostly turned down not for bad code, but because the change doesn’t fit the project’s scope or process.
Newcomers vs the rest
Compared with PRs from already-established contributors in the same window:
| newcomers | the rest | |
|---|---|---|
| PRs | 831 | 2454 |
| accepted (of all) | 50% | 70% |
| accepted (of completed) | 73% | 87% |
| tests written | 68% | 52% |
Newcomers are accepted less often, but they write tests more often (I think this may be related to LLM use; the quality of the tests themselves wasn’t analysed, but I did come across PRs where the tests check nothing, which again is typical of LLM-generated tests).
An important caveat: a “new participant” is someone whose first php-src PR falls within the studied period — this does not mean the person wasn’t involved in the PHP ecosystem in some other way or wasn’t a contributor to adjacent repositories.
And a few people carry the numbers — the top 10 authors opened 487 of 831 PRs (59%) and are accepted at 67%, while the other 209 authors sit at 27% (344 PRs). One author opened 232 PRs with 84% acceptance — that’s 28% of all newcomer PRs and 46% of the accepted ones; without him, overall acceptance drops from 50% to 37%. For a typical newcomer (median — 1 PR, 143 of 219 opened exactly one) acceptance is closer to 27%, and the optimistic 50/73% are propped up by a small group of active contributors. I’m leaving the raw data available so that, if needed, the “anomalies” can be excluded to get a cleaner picture.
Where most PRs land
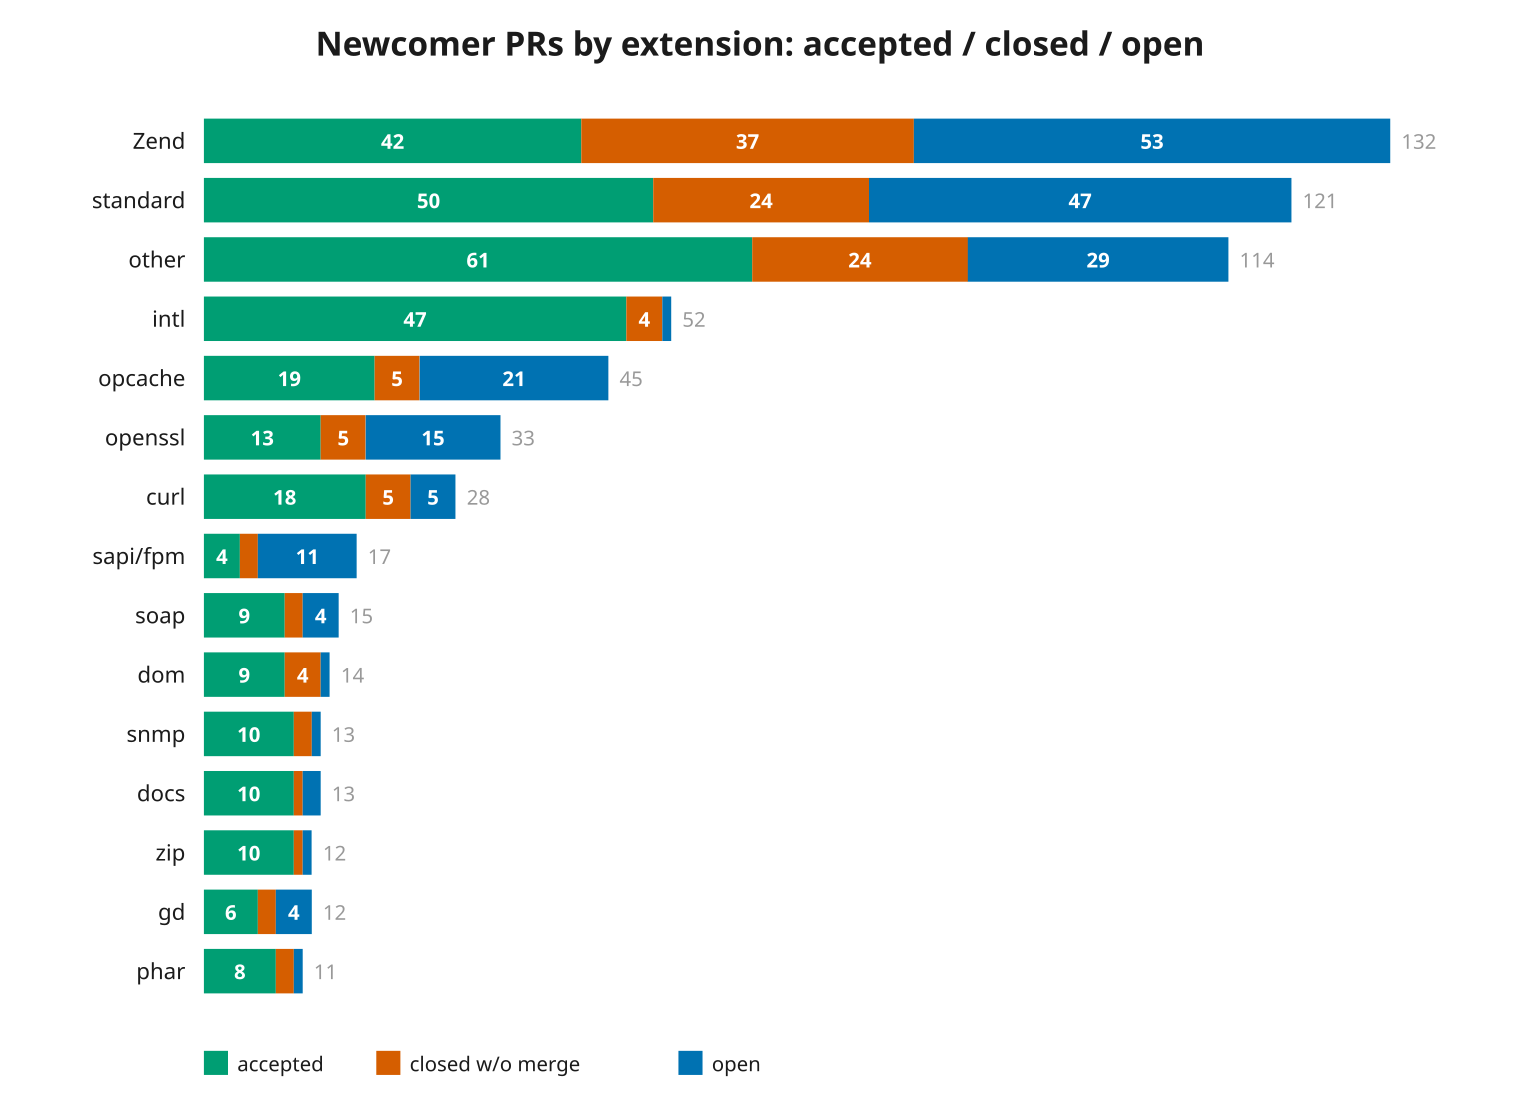
Newcomers bring the most PRs to the core (Zend — 132) and standard (121); that’s also where the most open PRs sit (53 and 47). The acceptance rate varies a lot by extension — for example, in intl 47 of 52 are accepted.
Issue links
Only 16% of newcomers’ PRs (135 of 831) formally close a reported issue (“Fixes #N”).
Of those 135 — who opened the issue the PR fixes:
| who opened the issue | PRs | share |
|---|---|---|
| the PR author themselves | 33 | 24% |
| another non-contributor | 57 | 42% |
| contributor / maintainer | 45 | 33% |
Most often a newcomer picks up a bug report from another non-contributor (42%), or finds the problem and fixes it themselves (24%).
And the outcome depends on it: your own issue goes through 48% of the time, an issue from a contributor/maintainer 47%, but someone else’s only 33%. PRs with no linked issue are accepted more often — 52%, though that’s heavy with those same active authors making direct changes.
PRs with AI-written descriptions
The analysis flagged 113 PRs (about 14%) as having an LLM-generated description. They were accepted noticeably less often:
| description | accepted |
|---|---|
| no AI signs | 55% |
| likely AI | 22% |
| clearly AI | 17% |
A sign of clearly AI generation is a disclosure in the description itself (Co-authored-by: Claude, a Claude Code footer, “LLM-generated”).
So PRs with an AI footprint are accepted roughly two to three times less often than those without.
This is a correlation, not causation: a sizeable share of AI PRs are the same out-of-scope or hastily put-together ones (including the spam accounts in the examples below), so it’s not “AI in itself” that suffers. An honest, careful description written with AI help isn’t penalised — what hurts acceptance is sloppiness, not the fact of disclosing AI use.
That said, there isn’t that much outright LLM junk; the most striking cases:
- #24502, #24586–24589 — fallout from the recent CVE events;
- #24590 — the author openly admits he’s not a developer but rather a researcher who wanted to help the project with an LLM, and promises to clean up his work;
- #21317 — an AI implementation of reified generics from a fresh anonymous account. Here most of the problem isn’t the code, it’s the RFC.
Coming back matters
Of 219 new participants, 143 opened exactly 1 PR, the other 76 more than one — but 47 of them did it in a single day. 362 of 831 PRs were opened by people who fired off a pile of PRs in one go.
24 authors (11%) opened a new PR after at least one of their PRs had been accepted.
At the author level: 82 of the 219 authors (37%) have had at least one PR accepted. The other 137 (63%) have none yet — but 100 of them still have an open PR pending, so only 37 authors (17%) are left with no acceptance and nothing open.
How easily a PR goes through depends a lot on which one it is in the author’s history. Let’s split all 831 PRs by the place each one takes in its author’s history (every PR in exactly one group; in parentheses — how many accepted):
- the author’s first PR — 219 PRs, 29% accepted (63);
- a later PR opened the same day as the previous one — 63 PRs, 27% accepted (17);
- opened on another day, but none of the author’s PRs had been accepted yet — 69 PRs, 33% accepted (23);
- opened after at least one of the author’s PRs had been accepted — 480 PRs, 66% accepted (315).
Only the last group moves the needle. Just opening more PRs — in a batch or before a first success — barely changes the odds (27–33%, same as the first attempt). The sharp jump comes only from a first success that’s already happened. And these 480 PRs came from just 24 people: a few who’ve found their footing carry the picture.
Cause and effect can’t be separated here, but the pattern is clear: what matters isn’t that you keep opening PRs, but your status as a contributor.
What’s stuck — and is it junk?
125 PRs are inactive (closed after silence, or open and idle for 50+ days). An agent read the diffs. Mostly it’s not junk: 74 are bugfixes, and the code quality is rated 4–5 out of 5 for 71 of them. Among the still-open stuck ones, 35 are currently in conflict with master, and 22 PRs have real conflicts in the code rather than in NEWS or UPGRADING.
Methodology: assessing AI generation
Descriptions were assessed in two passes.
A mechanical check for all 831 PRs:
- description length
- emoji
- the number of markdown headers and sections
- leftover PR template (
<!--, “Please provide”, ”### Description”, “Checklist”) - phrasing typical of LLMs: “This PR adds / implements / introduces…”, “Here’s…”, “I hope this helps”, “Key changes / features”, ”## Summary / Changes / Overview / Motivation / Testing / Rationale”, “in summary”, “as an AI”, “as requested”, “additionally / furthermore / moreover”.
By these signs, 93 PRs raised no suspicion at all; another 8 had a high score and were re-read by hand. The remaining 730 descriptions were also read by the LLM agent:
- clearly AI — with an explicit disclosure:
Co-authored-by: Claude, a Claude Code footer, “LLM-generated”, “Made with Cursor”, a mention of Codex / Devin; - likely AI — by style without a disclosure: templated sections, a marketing tone, over-completeness for a trivial change, checkbox test plans;
- hallucinations — only made-up facts: non-existent CVEs, fake test results, non-existent proofs.
The diffs of the 125 stuck PRs were read separately by the agent — to assess code quality and look for defects.
Where the data is fuzzy
Better to trust the shape of the picture than to over-trust the precision of the numbers:
- Description quality and the AI flag are partly subjective. Methodology above; another reader would rate some differently.
- There’s no formal validation of the LLM labelling. The close reasons, the AI flag and code quality were labelled by the agent; I spot-checked by hand but didn’t compute an agreement figure. “Quality 4–5/5” and “likely AI” should be read as an estimate, not a measurement.
- The manual-merge detector misses squash and cherry-pick. I know of at least two PRs that were actually applied by hand but show as closed — so real acceptance is a bit above 418.
- This is one window, newcomers only, and a descriptive analysis. I’m not claiming a statistically significant conclusion.
This study is about the overall picture, not about people: there are no personal assessments of developers here, all labels are aggregate PR features. The sample includes skilled, established participants who pull the numbers up.
Data
The summary tables (funnel, close reasons, the AI and return-rate breakdowns, stuck PRs) and the per-PR data are published in Google Sheets.